

By Roger Rowswell with contributions by Mike Palmer, Jim Cambray and Pat Irwin
Recently I received a copy of an edict/notice put out by the PE Met Office indicating that a 100-year flood was on the cards in the near future. This is an event I have anticipated occurring for a while but had not fully investigated the probability. There are promising signs that the drought will soon be over.
Weather is cyclical and I was aware that serious flooding had occurred in the past in the early part of the 19th century. A big flood was reported on early in the 1800s by George Barker while at the Theopolis Mission from 1815 to 1839, near today’s Southwell: In October, 1823 heavy rain persisted for 10 days flooding the countryside and was referred to as the “Flood of 1823”. Although hard and fast figures are not provided, it is evident from the written account and damage caused that it was a substantial flood. (See Addendum)
Currently Makhanda and large parts of the south-western areas of the Eastern Cape are in the grips of a severe drought. Droughts are often succeeded by flood events. The above has prompted this investigation.
The annual rainfall for 2019 was the lowest recorded by three stations in Makhanda with records of 27 years and longer and one station outside the municipal boundary to the west.
Table 1. Grahamstown experienced its lowest annual rainfall for a number of years in 2019
(LTA is the long term average. LT Med is the long term median.)
| Grahamstown | LTA (Period) | 2019 | % of LTA | LT Med (Period) | 2019 | % of LT Median |
| 4A Darling St | 725.9mm (34yrs) | 411.3mm | 56.6 | 695.7mm (34yrs) | 411.3 | 59.1 |
| Park Rd | 688.9mm (34yrs) | 465.3mm | 67.5 | 663.2mm (34yrs) | 465.3 | 70.2 |
| Cartwright Ave | 585.2mm (28yrs) | 371mm | 63.4 | 592.5mm (28yrs) | 371mm | 74.2 |
| Strowan Farm | 510mm (105yrs) | 323mm | 63.3 | 323mm |
The amount of rainfall at a specific station depends notably on topography and wind direction, rainfall is normally higher on the western and southern sides, however the northern areas periodically get higher rainfall than the southern areas during thunder storms (convectional rainfall) passing to the north of town.
Table 2. List of previous rainfall lows (mm) from highest to lowest since 1986
| Year | Darling St | Park Rd | Cartwright Ave | Strowan |
| 1998 | 594.1 | 653.7 | 675 | 550 |
| 1999 | 560.4 | 510.3 | 389 | 367 |
| 1990 | 557.1 | 554.1 | – | 394 |
| 2018 | 551.8 | 566.4 | 483 | 448 |
| 2016 | 535.2 | 512.7 | 435 | 347 |
| 1991 | 533.9 | 588.9 | – | 378 |
| 1987 | 511.0 | 513.7 | – | 383 |
| 1992 | 501.5 | 486.9 | 365 | 324 |
| 2019 | 411.3 | 465.8 | 371 | 323 |
Table 3. A comparison of low rainfall over three stations in Grahamstown
| Annual Rainfall lows – descending order | |||||
| Darling St | Park Rd | Cartwright Ave | |||
| Year | (mm) | Year | (mm) | Year | (mm) |
| 1998 1999 1990 2018 2016 1991 1987 1992 2019 | 594.1 560.4 557.1 551.8 535.2 533.9 511.0 501.5 411.3 | 1998 1991 2018 1990 1987 2016 1999 1992 2019
| 653.7 588.9 566.4 554.1 513.7 512.7 510.3 486.9 465.8 | 2009 2018 2016 2003 2007 2008 1999 2019 1992 | 498 483 435 431 427 418 389 371 365 |
In Table 3 above it can be seen that in the last 4 years Grahamstown has recorded three of the lowest rainfalls in 34 years, this is typical of drought periods, see early 1900 data on Figure 1.
Table 4. Highest annual rainfalls (mm)
| Year | Darling St | Park Rd | Cartwright Ave | Strowan |
| 2006 | 1161.8 | 940.0 | 771 | 772 |
| 2011 | 1151.6 | 1044.9 | 803 | 950 |
| 2002 | 1017.5 | 950.3 | 750 | 701 |
The earliest record of floods in the Albany District is from Rev. George Barker: ‘The Journal of George Barker at the old Theopolis Mission Station’, near Southwell, in the early 1815-1839 period: “1823 Oct; Heavy rain for 10 days from Sunday Oct 5th – The Flood of 1823”.
The earliest rainfall records in Grahamstown are from the old gaols, it was first in High Street 1879 to 1923 (currently the Auction House), then in 1824 it was moved to Somerset Street – Old Gaol – until 1974. It was then moved to Waainek. The two old gaol sites are so close to one another, within 50 to 100m of each other, that they can be considered as one record.
The Waainek records are not particularly relevant to rainfall in Grahamstown as the “Tronk” (TNK) as it is described by SAWS (South African Weather Services), is in the mist belt at the top of Howison’s Poort. In the table below one can see a similarity between those of the Old Gaol in the early 1900s and those of Darling Street in the early 2000s relative to their respective long term averages: Old Gaol (684.5mm) and Darling St (725.9mm) are similar. It should be mentioned that the Darling Street records (34 yrs) include the period of very high rainfall (Table 4) 2002 to 2011, whereas the Old Gaol records (95 yrs) included a large portion of very dry years. It is also very interesting to note that there were two wet years in 1886 and 1891 recording 1080.0mm and 1022.4mm respectively i.e. a rainfall peak. Similar to the peaks recorded in 2006 and 2011 (Table 4).
Table 5. A comparison of rainfall in the early 1900s and early 2000s
| Old Gaol | Darling Street | Comments | ||
| Year | Rainfall (mm) | Year | Rainfall (mm) | |
| 1915 1916 1917 1918 1919 1920 1921 1922 1923
| 623.6 477.2 816.6 588.4 444.0 491.3 807.1 998.3 621.8 | 2015 2016 2017 2018 2019 2020 2021 2022 2023 | 823.2 535.2 696.5 551.8 411.3 ? | R L Mullins – Serious drought 1914 to 1916
Very dry at both stations for respective periods
(124.4mm, June), (106.7mm, July) and (307.7mm, Nov) (130.8mm, Jan) |
Two old sets of rainfall records, from the early 1900s onwards exist: one from the Old Gaol in Grahamstown. At the time of the records referred to below it was situated near the top end of High Street, 1879 to 1923, and then in Somerset Street from 1924 until 1974 after which it was moved to the present site at Waainek. The second set is at Strowan Farm on the north-west side of Grahamstown, the record spans the period 1915 to present. Although the latter’s rainfall is not representative of that falling in Grahamstown the trend still follows the same pattern.
Table 6
| Year | Old Gaol | Strowan |
| LTA 684.5mm (95yrs) | LTA 512.6mm (101yrs) | |
| 1915 1916 1917 1918 1919 1920 1921 1922 1923 | 623.6mm 477.2mm 816.6mm 588.4mm 444.0mm 491.3mm 807.1mm 998.3mm 621.8mm | 401mm 499mm 680mm 425mm 375mm 315mm 559mm 825mm 445mm |
Of the 998.3mm falling in 1922 (Table 6) 304mm fell in a period of six days, Friday 3rd Nov to Wed 8th Nov, as shown in Table 7 below. This was referred to as “A Great Storm – The Heavy Deluge”: Grocott’s Daily Mail, Monday 6th November, 1922.
Table 7. Rainfall measured at different stations in and around Grahamstown in Nov, 1922.
| Where | Sat 4 Nov | Mon 6 Nov | Tue 7 Nov | Wed 8 Nov | Totals |
| City Hall Gowie’s Kloof Vet Lab Slaaikraal | 28.2mm 27.9mm 25.2mm | 211.6mm 188.5mm 190.8mm 152.4mm | 49.3mm 45.0mm 69.1mm 25.4mm | 15.2mm 13.5mm 20.8mm | 304.3mm 274.9mm 305.9mm 177.8mm |
The City Hall was where it is today in Church Square, Gowie’s Kloof was in the vicinity of today’s Gowie Dam and Graeme College, Vet Lab is the Veterinary Laboratories at the top of George Street and Slaaikraal is either the Farm Slaaikraal just beyond Strowan or at the Jameson and Milner Dams commonly called the Slaaikraal dams.
Figure 1. A comparison of annual rainfall trends in early 1900s and 2000s
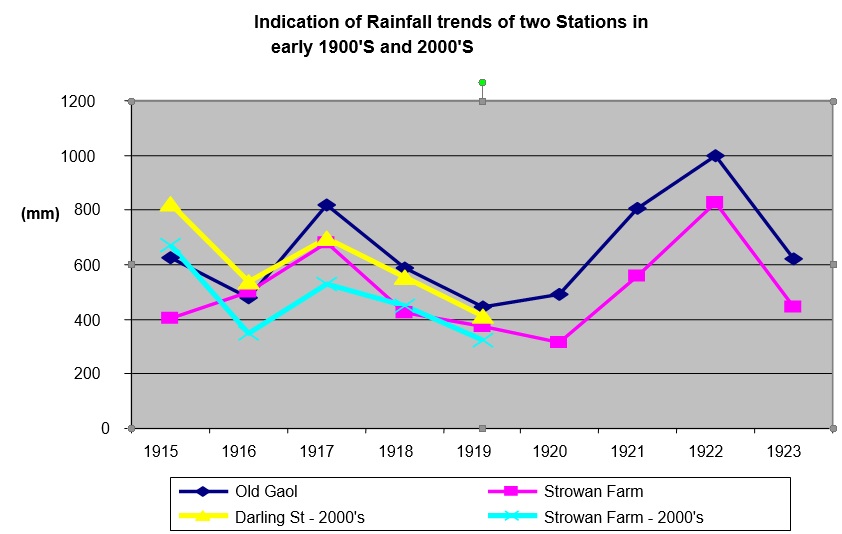
Looking at both record sets, Table 6 and Figure 1 above, it is evident that Grahamstown experienced significant rainfall and potentially floods in 1922 and this was preceded by several years of drought at both localities (R L Mullins). At the old gaol in High St significant rainfall was recorded in 1922 for June (124.4mm), July (106.7mm) and November (307.7mm) and was followed up by 130.8mm in January 1923. At Strowan Farm, ±6km west of Grahamstown centre, the following were recorded: 1922; June (116mm), July (86mm) and November (264mm) and in January 1923 (93mm). The average annual difference between Old Gaol and Strowan Farm is in the region of 150 to 175mm.
Looking at the data of the early 1900’s; 1915 to 1923, and the recent early 2000’s data it can be seen in both cases that the amount of annual rainfall recorded in the drier areas during the dry periods is notably closer to those of the wetter periods The drier areas being on the north side of town while the wetter areas are in the south. This is attributed to a higher incidence of convectional rainfall (thunderstorms) occurring on the northern side of town while the southern side does not receive regular frontal and orographic rains as had occurred in the latter half of 2019.
The graph above also shows the relationship between the historical drought; 1915 to 1916 and possibly longer and the current situation, early 2000s (2015 to 2019). The trend in both cases is similar, let’s hope it stays that way and we get a good dollop in 2022.
ADDENDUM:
A compilation from: Cory Library and Master of Arts Thesis (1983) by Marion Rose Currie; The history of the Theopolis Mission – 1814 to 1851.
The major portion of the text is from Appendix A, additional information is from M R Curries Master of Arts Thesis; extracts from George Barkers Diary, 1823
On Sunday, October 5th, 1823, a gentle rain set in and lasted throughout that day and Monday. The parched ground absorbed it as soon as it fell, and all nature seemed to be refreshed and to raise visions of a prosperous harvest. The clouds then broke and blue sky again appeared, but only for a while.
Gentle rain set in
Monday 6th October; rain
Tuesday 7th Oct; rain
Wednesday 8th October; rain
The rain commenced and continued in heavier showers until Thursday, when a storm of driving wind and a torrential downpour, which lasted for some hours visited the district. The earth had had its fill and thus every river ‘came down’ in full force and those “rivers” which, except on such occasions as that referred to, are as dry as the surrounding country became mighty rushing torrents.
Friday 11th October; Last night was the most awful night of heavy rain and wind from the SW. This was a tremendous day of driving rain, not to be described. Rain forenoon.
Saturday and Sunday were fine.
Sunday 13th October; This morning it rained very steadily, but kept increasing through the day. After dark the rain descended in torrents, with thunder and lightning. This night was the most awful of all, the rain by far the heaviest. Our river was swollen and overflowed the whole plain.
But Monday dawned with mist which turned to more rain. This increased throughout the day until, towards nightfall, the climax of all this arrived. A most terrific thunderstorm came over and seems to have lasted for hours. It was accompanied by violent winds and a deluge of rain, compared with which, according to the accounts, the fall of the previous Thursday was mere perspiration.
Monday 14th October: Never did I behold daylight with more pleasure than this morning. No one can conceive the anguish we were in all night, expecting every moment the house would fall upon us, but God spared us. This day showery.
The FLOOD of 1823, as this event is usually called, must have been awful. There does not appear to be on record any other storm in the Eastern Province which even distantly approached it either in its widespread violence or in the quantity of water which fell in so short a time. The rivers and streams, already full, overflowed their banks and inundated the surrounding country; large tracts of land being under water to a depth of 3 or 4 feet (1 to 1.2m).
Flood events are not necessarily related to high annual rainfall but to high intensity rainfall over a short period as high intensity rainfall results in significant runoff especially where the ground is saturated by previous good rainfall. As most people do not possess automatic rain gauges, which are capable of measuring rainfall intensity, the amount of rain falling in a specific period of time, a practical solution is to use the rainfall measured over a 24 hour period (8am to 8am the following day) for a month or year and divide it by the number of raindays (rds) in that period A rainday is a twenty four hour period in which 0.2mm or more rainfall is measured, For example; January 2020 had 129.3mm recorded over 15 rds = 8.6, it is felt that anything below 7.0 is not conducive to sufficient runoff to maintain meaningful stream flow for a length of time. The last reported 100 year flood in 1922 the rainfall at the old Gaol was 998.3mm over 84 raindays giving a ratio of 11.9. The last few years are an example of a low rainfall to raindays ratio producing no runoff to fill our dams to the south (Table 8).
Table 8. Ratio of rainfall to raindays in the last five years
| Year | Rainfall (mm) | Raindays | Ratio Rainfall/Raindays) |
| 2015 2016 2017 2018 2019 | 823.2 535.2 696.5 551.8 411.3 | 108 98 113 96 103 | 7.6* 5.5 6.2 5.8 4.0 |
*Although Settlers Dam didn’t overflow in 2015 it was reported to be fairly full. There were reports in 2017 that due to negligence the scour valve, opened to maintain stream-flow below the dam normally for short periods, was left open for approximately two weeks dropping levels considerably.
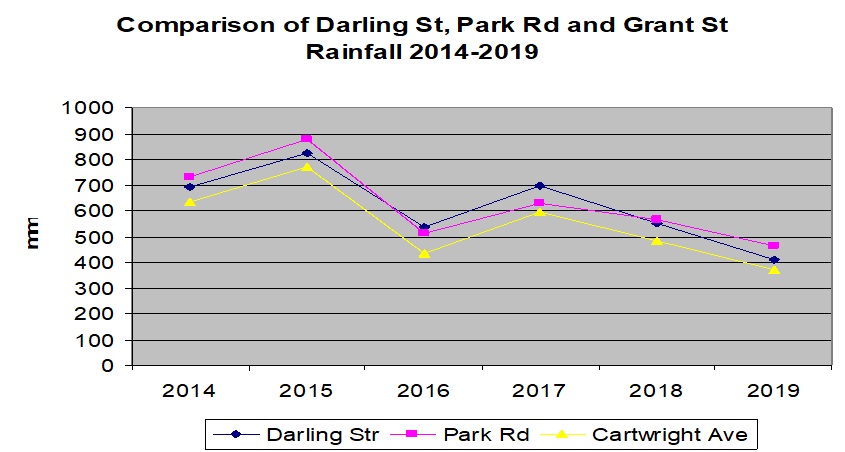
The graph (Figure 2) below indicates the decline in rainfall at three stations; Darling St, Park Rd and Cartwright Ave, in Grahamstown over the last four years; this is typical of drought prior to a 100 year flood, also see Figure 1.
Looking at the years that Settlers Dam overflowed (Table 9) since 1986:
Table 9. Ratio of annual rainfall to raindays leading to Settlers Dam spilling.
| Year | Rainfall (mm) | Raindays | Ratio (Rainfall/Raindays |
| 1989 1997 2011 2012 | 862.0 738 1151 913 | 100 87 133 123 | 8.62 8.47 8.65 7.42 |
Figure 2
A repeat of the above conditions in the next few years is what is required to fill our dams on the southern side of Grahamstown and alleviate us from the present long drought. Will we get it, yes, and when?, it’s coming soon. So says the Met office in PE; “a serious extreme event is on the horizon. WHEN EXACTLY is the BIG question” and our rainfall data for Grahamstown supports it.
Everyone including the Municipality should be prepared for such an event. Clearing and keeping all drainage systems free of debris, especially plastics, to reduce damage and environmental pollution during flood events, especially 100 year flood events.
So use water sparingly until the deluge occurs, after which we should have sufficient water in our dams to the south to lift restrictions partially.
References:
George Barker – Journal of George Barker 1815 to 1828 of Theopolis Mission.
R L Mullins – Grahamstown Water Supply; a brief history from 1812 to 2008