


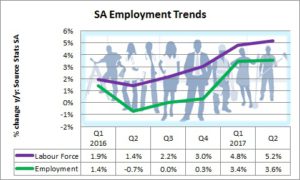

The mixed signals from the Purchasing Managers’ Index (PMI) and the Quarterly Labour Force Survey (QLFS) once again highlight why it is a job requirement for economists that they have two hands. On the one hand, the Standard Bank PMI shows that the private sector improved in July and the number of jobs increased by more than half a million (554 000) or 3.6% year-on-year (y/y) in the second quarter, while on the other hand, the Absa PMI showed a deterioration in the manufacturing sector and the unemployment rate remained stubbornly high at 27.7%.
The PMI is the first data point for the previous month, so it tends to set the tone for how economists view the month. It is a survey and asks respondents whether business conditions for a number of variables have improved, deteriorated or stayed the same compared with the previous month, as well as to provide reasons for any changes. The indices are then calculated by taking the percentage of respondents that reported an increase and adding it to one-half of the percentage that reported no change. This results in an index for which a value of 50 indicates no change in the activity, a value above 50 indicates increased activity and a value below 50 indicates decreased activity.
The headline Absa PMI composite index is calculated as the weighted average of the following indices (weights in parentheses): production (20%), new orders (20%), employment (20%), supplier deliveries (20%) and inventories (20%). Over time, the PMI has a good correlation with the manufacturing data collected by Statistics South Africa (Stats SA), but there is no direct one-to-one relationship as the weights of the industries for the PMI differ from that of Stats SA manufacturing data, but the purpose of the PMI is to give an early reading on manufacturing data, so the Bureau for Economic Research at the University of Stellenbosch, who compile the survey with sponsorship provided by Absa, does try to mirror the Stats SA manufacturing weights. In April for example, the PMI production component fell to 37.0 from 53.5 in March, but the Stats SA data showed a 2.3% monthly increase in April in manufacturing production. In a similar manner, the PMI production component dropped to 39.3 in July from 45.4 in June. The overall headline PMI has had a volatile few months, mostly due to political turmoil. The manufacturing PMI fell to 42.9 in July from 46.7 in June, 51.5 in May, 44.7 in April, 52.2 in March, 52.5 in February and 50.9 in January.
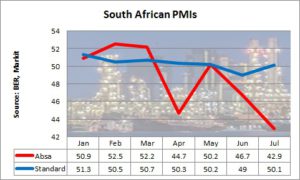
Standard Bank sponsor a similar survey compiled by Markit IHS, who compile the PMI for more than 30 countries such as Egypt, Kenya, Nigeria and Zambia. The Standard Bank PMI is a broader survey and covers approximately 400 private sector companies, which have been carefully selected to accurately represent the true structure of the South African economy, including mining, manufacturing, services, construction and retail. The IHS Markit also has different weights for the headline PMI with a greater emphasis on new orders and current business activity or production. Their weights are: new orders (30%), business activity (25%), employment (20%), suppliers’ delivery times (15%) and stocks (10%). The Standard Bank PMI rose to 50.1 in July from 49.0 in June. The components tracking new orders, employment and stocks of purchases climbed above 50, while that tracking output improved, but remained below the breakeven 50 level.
The QLFS was an overall positive data release even though the unemployment rate remained at 27.7% for the second consecutive quarter. The data showed that because I know a friend who has now got a job that it makes it worth my while for me to start looking for a job as well. That is why the number of discouraged workers, in other words those people who had given up looking for a job as there were none available where they lived, declined by 165 000 y/y in the second quarter. In addition, 307 000 people who had never looked for a job before, who were previously classified as not economically active, joined the labour force. This was added to the 627 000 who entered the labour force from natural population growth. The result was that instead of the labour force growing by the “natural” rate of 1.7% y/y, the increase due to discouraged workers and not economic active people, such as students and housewives, joining the labour force, the increase was 5.2% y/y. That is the dilemma politicians and economic commentators face. The more job prospects improve, which is great, the higher the unemployment rate is, as it attracts the discouraged workers and those who were not previously economic active into the labour force.
If the discouraged workers and those previously not economically active are then excluded from the number of unemployed, then the unemployment rate would have dropped to 25.6%. This significant drop in the unemployment rate would have been great news, but instead the headlines read that unemployment rate stayed near multi-year highs. That is why one has to drill down into the marrow of the data releases as in this case, the good news, not the devil, lies in the detail.

